月火水木金土日
pythonとyfinanceで株価取得
諸事情によりPythonで株価を取得するコードを書いた。
株価を取得するAPIは有料から無料までいろいろあるが今回はただ呼び出せば使える yfinance をつかう。
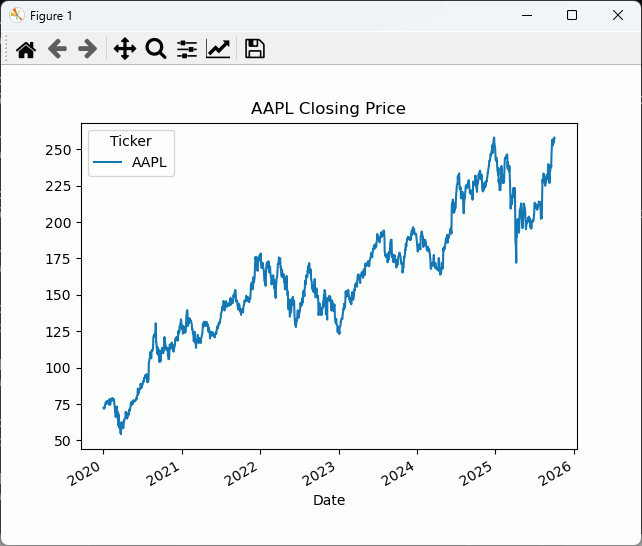
yfinanceでデータを取得してグラフ表示
###################################
# 株価取得
###################################

import yfinance as yf
df = yf.download("AAPL", start="2020-01-01", interval="1d")

###################################
# 終値をグラフ表示
###################################

import matplotlib.pyplot as plt
df["Close"].plot(title="AAPL Closing Price")
plt.show()
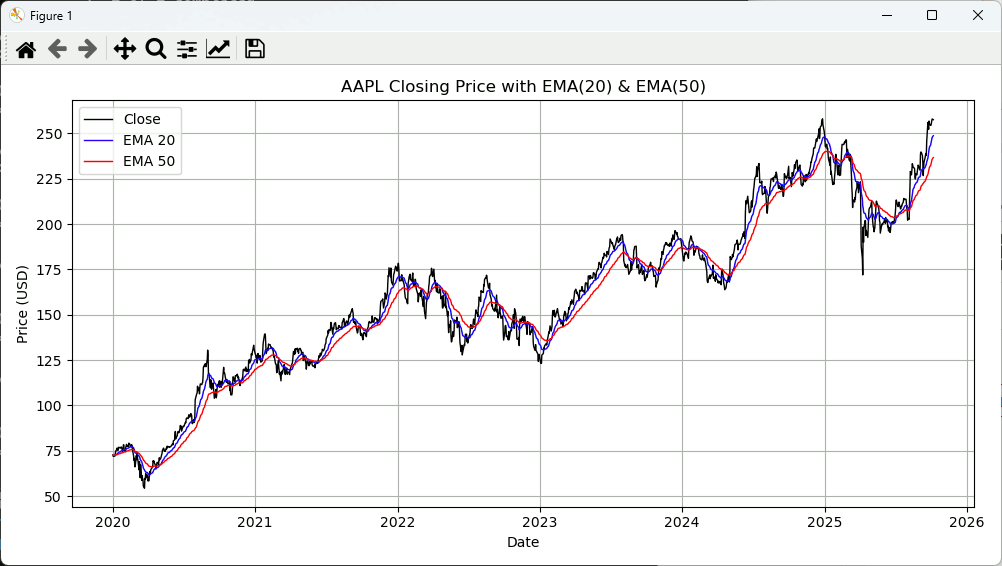
EMAを計算して同時に表示
import yfinance as yf
import matplotlib.pyplot as plt

# データ取得
df = yf.download("AAPL", start="2020-01-01", interval="1d")

# EMA(指数移動平均)を計算
df["EMA20"] = df["Close"].ewm(span=20, adjust=False).mean()  # 20日EMA
df["EMA50"] = df["Close"].ewm(span=50, adjust=False).mean()  # 50日EMA

# 終値とEMAを同じグラフに描画
plt.figure(figsize=(10, 5))
plt.plot(df.index, df["Close"], label="Close", color="black", linewidth=1)
plt.plot(df.index, df["EMA20"], label="EMA 20", color="blue", linewidth=1)
plt.plot(df.index, df["EMA50"], label="EMA 50", color="red", linewidth=1)

plt.title("AAPL Closing Price with EMA(20) & EMA(50)")
plt.xlabel("Date")
plt.ylabel("Price (USD)")
plt.legend()
plt.grid(True)
plt.tight_layout()
plt.show()
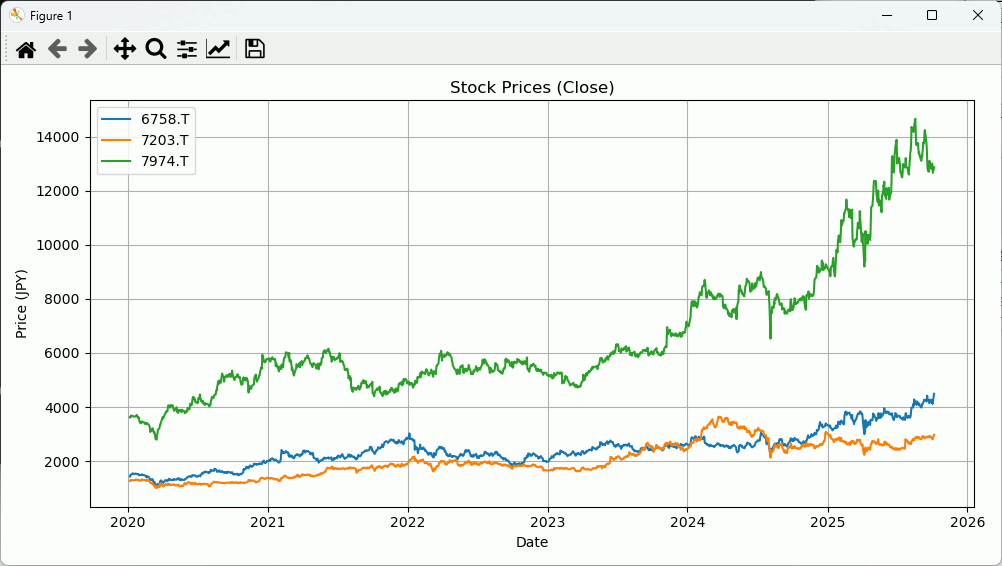
日本株の場合
日本株は銘柄の後に.Tをつけるといいらしい。
import yfinance as yf
import matplotlib.pyplot as plt

tickers = ["7203.T", "6758.T", "7974.T"]

# 一括取得
df = yf.download(tickers, start="2020-01-01", interval="1d")["Close"]

# DataFrame の確認
print(df.head())


print("==========================")
# 銘柄
for symbol in df.columns:
    print(df[symbol])

print("==========================")
# グラフ描画
plt.figure(figsize=(10, 5))
for symbol in df.columns:
    plt.plot(
      df.index,      # 横軸 日付
      df[symbol],    # 縦軸 価格
      label=symbol   # 凡例のラベル
    )

print("==========================")

plt.title("Stock Prices (Close)")
plt.xlabel("Date")
plt.ylabel("Price (JPY)")
plt.legend()
plt.grid(True)
plt.tight_layout()
plt.show()